
Table of Contents
The Flatbed Split: One Trailer, Two Markets
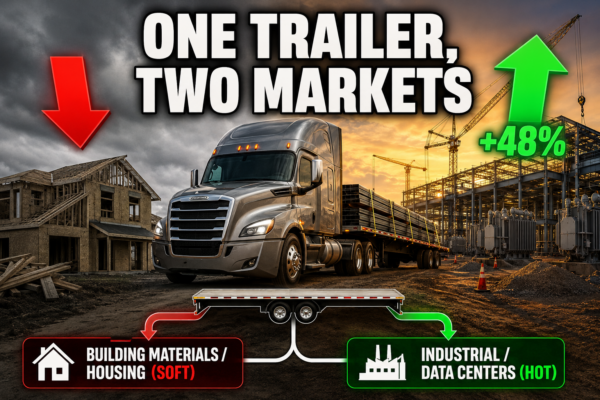
If you only saw one number from the freight market this year, it was probably flatbed volume up 48 percent. That number is real. It is also one of the most misleading figures in trucking right now, because it describes an average that almost nobody is actually hauling.
One flatbed trailer is running two completely different markets at the same time, and which one you are in depends on what you load and where you run. One side is soft, held down by a stalled housing market. The other side is booming on industrial and data-center construction. The flatbed freight market in 2026 is really two markets sharing one deck, and the headline is the average of both. This breakdown walks through the split, the data behind each side, and what it means for reading a rate before you book it.

Companion video: The Flatbed Split (AFT Dispatch).
The Flatbed Split
The problem with a single headline number is that flatbed is not one market. It is two, sitting under the same deck.
On one side you have traditional building materials: lumber, drywall, roofing, the freight that moves when houses get built. On the other side you have industrial freight: steel, concrete, and the equipment going into data centers and the power grid that feeds them. The 48 percent volume figure is the average of those two sides.
An average of a weak market and a booming one matches neither. If you haul building materials into residential construction, your year does not feel like plus 48 percent. If you haul structural steel to an industrial site, it feels like more. It is the same trailer running two different businesses.
This matters because of how operators actually shop for freight. You open a load board, filter by your equipment, and read the column of rates as one market having a good month. It is not one market. A flatbed board shows steel coil heading to a fabrication plant in the same list as drywall heading to a stalled residential subdivision, and those two loads are pulled by opposite forces: industrial demand that is climbing and housing starts that are falling. Reading them as a single trend is how an operator talks himself into a soft lane because the board looked strong overall.
The Soft Side: Building Materials and Housing
Start with the struggling side, because it is the one most flatbed operators came up hauling.
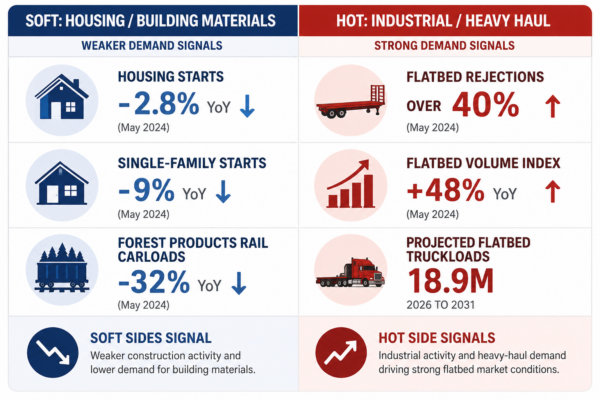
Traditional building-materials flatbed is soft. Housing affordability and high interest rates are holding volumes down, and the construction data shows it plainly. Per FreightWaves SONAR reporting, total housing starts fell 2.8 percent month over month in April, to a 1.465 million seasonally adjusted annual rate. That is down 0.9 percent from a year earlier.
The headline starts number hides the part that matters for freight. Single-family starts dropped 9 percent in a single month, down to 930,000 units, while multifamily starts rose 14.3 percent to 529,000. The category that pays flatbed operators is the one that fell, and the category that rose does little for your deck.
The reason single-family starts matter so much to a flatbed operator is volume per home. A subdivision is dozens of separate framing packages, roofing loads, and drywall deliveries spread across a sprawling site and arriving on flatbeds over months. An apartment building stacks those units vertically and consolidates the delivery, so the building-products freight per dwelling falls hard when construction shifts from horizontal to vertical. A single-family number falling 9 percent is a direct signal that the framing lumber, roofing, and drywall runs a building-materials hauler depends on are drying up at the source.
The rail data tells the same story from another angle. Forest and lumber products rail carloads fell 32 percent year over year, down to 788 weekly carloads as of late May. On its first-quarter earnings call, the Class I railroad CSX called housing affordability a real headwind, with its forest-products volumes sliding 9 percent year over year. When the railroads and the trucks show the same decline in the same commodity, the market is telling you something consistent.
That is the soft side. The operators who built their businesses around lumber and residential building materials are not imagining the slow year. The data backs them up, and this side does not turn around until housing affordability does.
If you want this kind of market breakdown on a regular basis, the free trucking education at AFT Dispatch goes deeper on how the freight market actually works:
The Hot Side: Data Centers, Steel, and the Grid
The industrial side is where the 48 percent actually comes from, and the scale is hard to overstate.
Per the same FreightWaves SONAR data, flatbed tender rejections pushed past 40 percent in April. The Flatbed Truckload Volume Index was up an average of 48 percent year over year as of June. And the driver is not housing. It is heavy-industrial, data-center, and utility construction.
A tender rejection rate over 40 percent is the most useful number here for a flatbed operator, so it is worth knowing what it means at the dock. A tender is a load a shipper offers a carrier it already has under contract, at the contracted rate. When the carrier rejects it, that load falls into the spot market and gets priced at whatever it takes to move it that day. A 40 percent rejection rate means roughly two of every five contracted industrial flatbed loads are being turned down and re-priced higher on the spot boards. For an operator with an empty deck, that is the mechanism putting well-paying spot freight in front of him. High rejections are the reason a steel load out of an industrial hub pays what it pays right now.
Here is the piece most operators have not sized correctly yet. According to FreightWaves reporting on the AI build-out, the AI data-center build-out is the largest privately funded infrastructure program in United States history.
You have probably heard the stories. These campuses are going up all over the country, and one of the biggest was proposed in Utah. The Stratos project in Box Elder County was pitched as one of the largest data centers in the world, planned across about 40,000 acres, roughly the size of Washington, D.C. It cleared a state authority in late April and the county commission in early May. Then, after pushback from residents and lawmakers, the developer agreed to cut the footprint roughly in half, down to around 20,000 acres. And of that reduced footprint, about half is set to stay undeveloped as agricultural and wildlife land, which brings the effective development area to roughly 10,000 acres. Even at that reduced size, it represents an enormous amount of construction, and every yard of concrete, every beam of steel, and every transformer that goes into a site like that rides in on a truck.
The scale is hard to hold in your head, so here is a comparison. The Interstate Highway System took 35 years to build, at roughly 18.8 billion dollars a year. The data-center build-out spends that much on construction and power about every five weeks. All of that construction moves on trucks: an estimated 18.9 million incremental truckloads of materials and equipment between 2026 and 2031, the equivalent of adding a whole new freight market on top of the one we already have. Concrete and structural steel moving in volume are pushing flatbed rejections to multi-year highs. Roughly 70 percent of this demand is truckload, and the generators, transformers, and transmission equipment squeeze flatbed capacity specifically, because that is heavy, oversized freight that needs a deck.
The spending is still climbing. United States data-center investment is on track to pass 500 billion dollars a year by 2027, a 4.16 trillion dollar total over six years. About 460 billion of that sits outside the data-center fence line, in utility-side transmission and grid infrastructure. The grid is its own enormous freight market, most of it moving heavy on flatbed, and it is the more durable signal: campuses get built and finish, but the transmission work that connects them runs longer and spreads wider.
Vans, Reefers, and Where the Work Actually Is
This split does not stop at the flatbed deck. It reaches vans and reefers too.
Dry van volumes are also held back by the housing slowdown, because less residential construction means less of the related retail and furnishing freight that fills vans. So van operators feel the soft side as well. But the industrial build-out pulls the other way. Van and reefer capacity is being stretched by deliveries of sensitive semiconductors, batteries, and precision cooling equipment headed for data centers. That is temperature-controlled and high-value freight, and it is competing for the same trucks.
There is one more signal worth watching, and it is in the warehouses. According to Link Logistics, which manages around half a billion square feet of warehouse space, the 2024 oversupply correction has run its course. National warehouse availability dropped for the first time since 2021, and the new-warehouse construction pipeline contracted 35 percent. Tighter space favors last-mile owner-operators, and the AI build-out is adding warehouse demand on top of that.
The Operator Takeaway
The plus 48 percent headline is not your market. It is not anyone’s actual market. Reading your own lane and commodity, not the national average, is the whole job in a market like this.
What pays right now is the commodity and the lane. Steel, concrete, and grid equipment near industrial and data-center corridors are moving. Building materials into stalled housing are not. The disciplined read is to know which side of the split your freight sits on before you chase a headline number.
Put it in terms of a booking decision. Two loads come up at similar rates: one hauling roofing trusses into a residential development, the other hauling structural steel toward an industrial site. The board rate looks comparable, so they look like the same load. They are not. The roofing load sits on the side the housing and rail data say is still falling, so the backhaul is likely weak and the next load harder to find at a good rate. The steel load sits in the corridor where rejections are over 40 percent, so the surrounding lanes are tight and the reload prospects are better. Same rate on the board, two different weeks behind them. The operator who knows the split takes the steel even when the roofing pays a few dollars more, because the next load is part of the real number.
The headline tells you the average. Your settlement statement tells you your market. When the two disagree, trust the one with your name on it.
If you are working through where your lanes sit in this split, the full library of free trucking education is available below:
Frequently Asked Questions
Why is flatbed volume up 48 percent in 2026?
The 48 percent figure is the Flatbed Truckload Volume Index, up an average of 48 percent year over year as of June 2026. The increase is driven by industrial demand, not housing. Data-center and utility construction are moving large volumes of concrete, structural steel, and oversized electrical equipment, all of which need a deck. The building-materials side tied to residential construction is actually soft. The 48 percent is an average of the two, which is why it does not match what many operators see on their own lanes.
Why is building-materials flatbed freight down when overall flatbed is up?
Building-materials flatbed is tied to housing, and housing is stalled by affordability and high interest rates. Total housing starts fell 2.8 percent month over month in April 2026, and single-family starts dropped 9 percent in a single month. Forest and lumber rail carloads fell 32 percent year over year. The industrial side is booming at the same time, so the overall index rises even as the building-materials side declines. The average masks the divide.
How is the AI data-center build-out affecting trucking?
The build-out is generating an estimated 18.9 million incremental truckloads of construction materials and equipment between 2026 and 2031, roughly 70 percent of it truckload freight. Concrete, structural steel, generators, transformers, and transmission equipment are squeezing flatbed capacity specifically, because that freight is heavy and oversized. United States data-center investment is on track to exceed 500 billion dollars a year by 2027, with about 460 billion of the six-year total going to grid-side transmission and infrastructure that also moves heavy on flatbed.
Does the data-center boom affect vans and reefers too?
Yes. Dry van volumes are held back by the housing slowdown. At the same time, van and reefer capacity is stretched by deliveries of semiconductors, batteries, and precision cooling equipment headed for data centers. Warehouse availability dropped for the first time since 2021, and the new-warehouse pipeline contracted 35 percent, which tightens space and favors last-mile owner-operators. The same soft-versus-hot split shows up across equipment types, not just flatbed.
Reading Your Side of the Split
The flatbed market in 2026 is two markets wearing one number. The building-materials side is soft and tied to a housing market that has not recovered. The industrial side is tight, driven by the largest privately funded construction program in the country’s history. The 48 percent headline averages them into a figure that describes neither one. The operators who do well know exactly which side their freight sits on, and price and plan around that instead of around a headline.


Leave A Comment