
Table of Contents
For close to four years, the load boards did not make sense for most carriers. You ran the numbers on a load, and the numbers did not work. That has changed. In the freight market of 2026, rates are up across every major equipment type, and a lot of carriers are seeing real margins again for the first time since 2022.
The rates are worth understanding, but the reason behind them matters more. This recovery is not built on a booming economy. It is built on something else, and what that something else is tells you how long the higher rates are likely to hold and what a careful operator should be doing while they last. The sections below walk through the current rate picture, the two forces actually driving it, and the operational decisions that separate carriers who keep the gains from carriers who give them back.
Watch the full market breakdown: Freight Market Update 2026 (AFT Dispatch)
Where Rates Sit Right Now
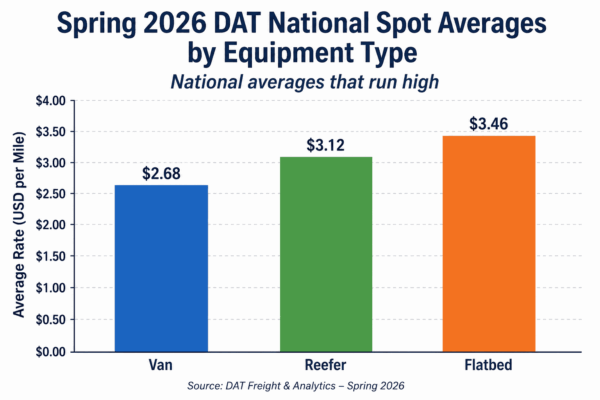 This is not one number. It is three, and they are not the same. As of spring 2026, DAT national spot averages are running roughly $2.68 per mile for dry van, around $3.12 for reefer, and flatbed is the standout near $3.46. Flatbed had the biggest move, up around 12 percent in a single month, as construction and steel demand pick up for the season. Reefer is strong on produce. Van is the slowest of the three, though still clearly above where it sat last year.
One caveat carries through this entire article. These are national averages, and they run high. You do not haul freight nationally. You haul it on one lane between two markets. A national average is a ceiling conversation, not your personal rate. The load board number for your specific lane is the one that pays your bills, and it is usually below the national figure.
Why Rates Are Actually Up
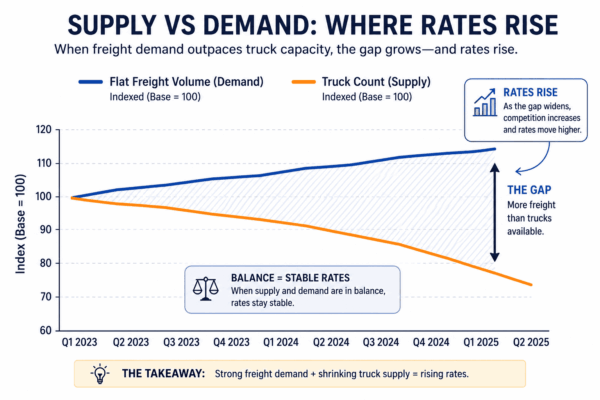 Most people get this part wrong. Rates did not climb because freight demand came roaring back. Volume is basically flat. Rates climbed because trucks left the market. Four years of running at a loss pushed carriers out of business, and now there are fewer trucks competing for roughly the same amount of freight.
That distinction is the whole story. This is a supply story, not a demand story. A recovery built on missing capacity behaves differently from one built on a growing economy. When demand drives a recovery, the floor under rates is real, because the freight is actually there. When tight capacity drives a recovery, the floor is only as stable as the shortage. Add trucks back, and the math shifts again.
If you want this kind of breakdown on the freight side of the business, the AFT education series goes mechanism by mechanism:
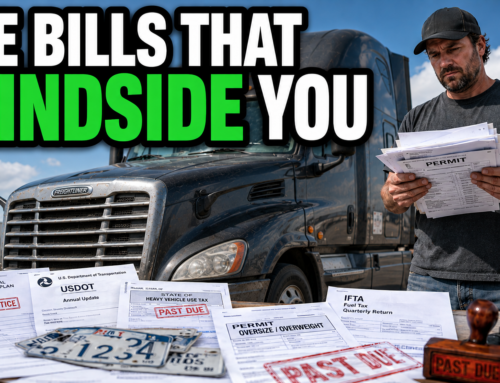
The Enforcement Squeeze on Capacity
 There is a second force tightening capacity, and it has been in the news all year. The federal government spent the last year enforcing rules that were on the books but had gone largely unenforced.
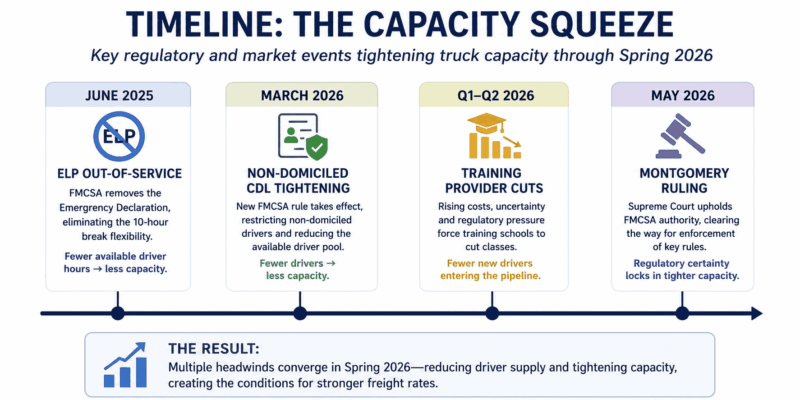
First, English language proficiency is now an out-of-service condition at roadside. A driver who cannot meet the requirement during an inspection can be placed out of service on the spot. Second, the non-domiciled CDL rule was tightened, narrowing who can obtain or renew one. Third, thousands of training providers were pulled from the registry.
Taken together, some analysts estimate these changes could remove somewhere between 5 and 12 percent of CDL holders from the supply over the next couple of years. Carriers have started calling this the triple threat: the English requirement, the non-domicile tightening, and the training cuts. It is a meaningful part of why capacity keeps shrinking even though freight itself is not surging.
The Broker Liability Ruling That Changed the Math
Something happened in May that many carriers have not fully absorbed. The Supreme Court ruled, unanimously, that freight brokers can now be sued when they hand freight to an unsafe carrier and something goes wrong. The case is Montgomery v. Caribe Transport, decided May 14, 2026.
For years, brokers relied on a federal preemption argument that got these negligent-selection cases thrown out. That shield is gone. The practical effect for carriers is direct. Brokers are now cautious about putting a load on a carrier with a poor safety record, because if that carrier is in a crash, the broker can be named in the lawsuit. So brokers are checking your SAFER profile, your inspection history, and your safety scores before they will book you.
A clean record used to be a nice-to-have. It is now the difference between getting the load and getting passed over. This stacks directly on top of the enforcement changes. Between the out-of-service rules and brokers vetting harder than they ever have, the carriers who keep their paperwork and their safety record in order are the ones who will keep getting freight. Carriers with a sloppy record will watch loads dry up, and many of them will not understand why.
The freight education series covers the broker side in detail, including how carrier vetting and credit work in real operations:
A Recovery Worth Reading Carefully
This recovery is real, but it is uneven and it is conditional. It varies by lane, by region, and by week. Flatbed is hot right now because of construction. When construction slows, flatbed cools. The entire picture rests on capacity being tight, and capacity can return. The moment rates look good for long enough, trucks come off the sidelines, and the math begins to flip back.
This is the point where discipline matters. I have watched too many carriers treat a strong quarter like a permanent raise. The line I have used for years still holds: what comes up must come down. This is not the moment to buy a second truck on credit and a matching pickup to go with it. It is the moment to build the cushion you wished you had during the last four years. The operators who survive the next downturn are the ones setting money aside now, paying down debt, and getting their fixed costs as low as they can while the revenue is there to do it.
The Mistake From Last Time
This pattern has played out before. During the COVID years, rates went higher than anything in the current market, and a lot of carriers treated those rates as the new normal. They spent on new trucks, bigger fleets, and the lifestyle that comes with a good year. Very few set money aside.
When rates fell, the carriers who had grown the fastest were hit the hardest. They carried more debt and overhead into a soft market with no freight to cover it, and many ended up worse off than before the good year started. The good years are when a careful operator prepares for the lean ones, because the lean ones always come. That is not pessimism. That is the freight cycle.
How a Disciplined Operator Plays This Market
Three habits separate the carriers who keep the gains from the ones who give them back.
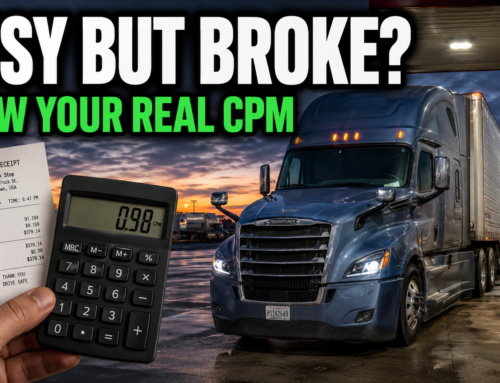
First, know your true cost per mile. The real number, with everything in it, not an estimate. You cannot tell a good load from a bad one without it. That number comes from a profit and loss statement built around how a trucking business actually spends, fuel, payments, insurance, maintenance, tires, tolls, and the fixed costs that run whether the truck moves or not. Until you have it, every load is a guess.
Second, be willing to say no. In a market like this, the most profitable operators turn down more freight than the average driver. They are not chasing a high gross on a lane that loses money once the deadhead home is counted. Saying no with confidence means reading the real rate on a load, what is left after broker margin, fees, and the miles you run empty to get there, not the headline number on the load board.
Third, run lanes with reloads, not one-way traps that strand you with empty miles home. The rate per mile on the load board means very little if half your week runs unpaid. A strong rate into a weak market can cost more than a moderate rate into a market where you can reload.
The Forward Look for 2026
The forecasts call for continued gradual improvement, with contract rates up around 8 percent and spot rates up around 12 percent over the next year, though with real risk attached. Nobody is calling this a boom. Cautious optimism is the honest read.
There is one detail in those numbers worth sitting with. Spot is forecast to rise faster than contract. For most of the freight cycle, contract leads and spot follows. Spot running ahead of contract is the reverse of what carriers have grown used to, and it is a signal in itself. Most independent carriers and owner operators live and die in the spot market, booking load to load rather than under a fixed contract, so this inversion is worth watching closely as the year develops.
The freight market is not the only area where the rules shifted under carriers this year. The regulatory environment is moving quickly, from safety enforcement at roadside to licensing and compliance questions that did not used to come up. Carriers who treat current conditions as information to act on, rather than a reason to relax, are positioned for whatever comes next in the cycle.
Frequently Asked Questions
Why are freight rates going up in 2026?
Freight rates are rising in 2026 mainly because of reduced truck capacity, not increased demand. Four years of low rates pushed many carriers out of business, and federal enforcement actions have tightened the driver supply further. Volume has stayed roughly flat. With fewer trucks competing for about the same amount of freight, rates have moved up across dry van, reefer, and flatbed. Because the recovery rests on tight capacity rather than a growing economy, it behaves differently from a demand-driven recovery, and it can reverse if trucks return to the market.
How much have trucking rates risen in 2026?
As of spring 2026, DAT national spot averages are running roughly $2.68 per mile for dry van, around $3.12 for reefer, and near $3.46 for flatbed, which saw the largest jump at about 12 percent in a single month. These are national averages and they run high. An individual carrier’s rate on a specific lane is usually lower than the national figure. The forecast calls for contract rates up around 8 percent and spot rates up around 12 percent over the next year, though analysts describe the outlook as cautious optimism rather than a boom.
What does the Montgomery v. Caribe Transport ruling mean for carriers?
The Supreme Court’s unanimous decision in Montgomery v. Caribe Transport, issued May 14, 2026, allows freight brokers to be sued for negligent carrier selection. The federal preemption argument brokers previously relied on to dismiss these claims no longer applies. For carriers, the practical effect is that brokers now scrutinize safety records, inspection history, and SAFER profiles before booking a load, because a carrier’s crash can become the broker’s lawsuit. A clean safety record has shifted from a nice-to-have to a direct factor in whether a carrier gets the load or gets passed over.
What to Do With This Window
Higher rates in 2026 are a real opportunity and also a test. The carriers who read this market correctly understand that the gains come from a capacity shortage that can ease, and they treat current revenue as a chance to build a cushion rather than expand on credit. Knowing your real cost per mile, declining loads that do not pay once empty miles are counted, and keeping a clean safety record in a stricter enforcement environment are the habits that hold up when the cycle turns. The freight market always turns, and the work is in being ready while the revenue is still there to prepare with.


Leave A Comment